The boom did not diversify the economy.
Bolivia’s gas boom funded pensions, cash transfers, and the state, but did not last. In 2014, three huge gas fields provided over 70% of Bolivia’s gas. These resources funded an old-age pension and a school-attendance grant, among other social protection measures. Then, between 2014 and 2025, gas production fell, and the country had to cut gas delivery to Brazil in 2019.
As Bolivia’s gas boom ends, social protection is weakening and serving as a warning for Guyana. In 2013, the Bolivian oil and gas sector provided 33% of state revenue, about US$12.8 billion. From 2024 to 2025, the share of Bolivians below the World Bank upper-middle-income poverty line rose from 17.4% to 19.5%. By 2025, inflation had eroded the purchasing power of social transfers, including pensions and grants. In late 2025, the government cut fuel subsidies. In June 2026, Bolivia ended its fixed dollar rate. Guyana is in the early stages of a similar boom and has plenty of new cash.
The Bolivia gas boom benefited families, but the state lacked skills and capacity, and then the gas dried up. After 2005, Bolivia’s income gap fell by 3.4% a year, but manufacturing stagnated at about 15% of GDP. The three major gas fields came from 1990s exploration, but new discoveries did not replace them. The state lithium firm (YLB) invested more than US$800 million in a lithium plant. But the plant operated at very low capacity. This blog asks what happened in Bolivia, how the changes took place, and why the boom collapsed.
Poverty fell, exports concentrated, and then gas output halved.
Major gas fields increased Bolivia’s gas output until 2014, but dependence on them led to a decline afterwards. San Alberto, Sabalo, and Margarita began producing gas in the early 2000s. At its peak, in 2014, Bolivia produced 22.188 billion cubic meters of gas. From 2014 to 2025, gas output dropped from 59.6 to 27.3 million cubic meters per day. The decline was largely due to reduced production in the three mega-fields. In 2023, Bolivia’s gas, oil, and fuels output averaged 60% of their 2014 peak levels.
After 2005, Bolivian gas policy focused on extracting from existing fields rather than finding new gas. The three official estimates made after 2006 found less gas. From 2002 to 2013, the proven gas reserves fell from 812 to 296 billion cubic meters. In 2016, official estimates indicated 13.3 years of gas left at that year’s output levels. The rapid fall in reserves may have stemmed from earlier overestimation.
Poverty dropped while funds flowed.
Poverty fell fast while the state paid new grants from gas money. In 2006, experts classified 60% of Bolivians as moderately poor. Extreme poverty fell by 2.3 points a year, from 38.2% to 17.3% between 2005 and 2014. In 2009, the Juana Azurduy conditional cash grant began supporting mothers-to-be and children up to the age of two. Juancito Pinto was also a conditional cash transfer for school attendance, while Renta Dignidad was a universal old-age pension. In 2025, Bolivia’s economy contracted by 2.1%. Since then, slowing growth and high inflation have reduced the state’s capacity to spend on social protection.
On paper, the income gap appeared to narrow during the boom. From 1999 to 2011, the Gini coefficient went from 0.59 to 0.46. However, the data may have excluded some high-income actors. The methodology may also have missed funds sent abroad in dollars. After 2014, individuals and firms moved accounts offshore and into dollars.
Extractives grew as a share of total exports from 2003 to 2019. The export share of mining and gas increased by 22 percentage points between 2003 and 2016. In 2016, gas, oil, and mining accounted for 72% of exports. By 2019, they accounted for 80% of Bolivia’s exports, and oil and gas brought in 25% of fiscal revenue.
High prices drove gas; policy picked other businesses.
Global commodity prices drove growth in Bolivia’s gas sector. Bolivian gas prices went from US$2 to US$10 per million British thermal units between the early 2000s and 2012. Royalties rose in 2008 and 2011 mainly because of higher prices, not higher volumes. Higher prices, new taxes, and higher volumes increased revenues from 25.1% of GDP in 2005 to 28.5% of GDP in 2008. In contrast, the 2006 changes added only about 0.6 points to annual growth. Public oil and gas income peaked at 22.9% of GDP in 2014 but fell to 11.5% of GDP in 2021. From 2006 to 2019, Bolivia’s per capita GDP increased from US$1,227 to US$3,552.
Bolivian exporters faced negative effects from the fixed dollar rate and export bans following 2008. In February 2008, the government banned exports of beef, maize, sugar, poultry, and rice. In November 2011, the Central Bank fixed the boliviano against the dollar. Between 2008 and 2016, the boliviano increased by about half in real value against trading partners. By 2016, the UN Economic Commission for Latin America and the Caribbean (ECLAC) warned that the rising boliviano could hurt firms trying to export new products.
Taxes and subsidies opened space for mining and farming.
Mining policies shifted production toward small gold cooperatives and away from large mines. High mining taxes deterred large mining investments and favored small cooperative mines. No large-scale mines opened in Bolivia between 2008 and 2026. Meanwhile, mining cooperatives grew from about 50,000 to over 150,000 workers between 2004 and 2024. By 2021, mining cooperatives produced over 90% of Bolivia’s gold, while gold output grew from 6.4 to 45 tons between 2010 and 2021.
Cheap diesel and cheap land meant growth in soy and cattle. In 2019, soy had three strengths that gave it an edge: affordable land, government-subsidized diesel, and preferential access to the Andean market. By 2024, fuel subsidies for gasoline and diesel cost the budget about 3.9% of GDP. The land area set aside for soy production grew by 191% over the twenty years to 2016. Livestock output grew 70% in value, with the herd adding about 2.6 million head to reach 9 million by 2017.
Compare the Bolivian gas boom to the Colombian coffee booms. The Colombian coffee boom sent money directly to farming families, whereas Bolivia’s gas money flowed indirectly through the government. After 2006, all Bolivian gas producers sold their output to the state oil and gas firm (YPFB). In Antioquia, the share of coffee farms owning hand-operated pulping machines rose from 70% to 97% between 1915 and 1922. Colombian coffee processing moved from large, dominant estates to family farms. This helped the Colombian boom translate directly into new economic opportunities.
The plans, loans, and spending outpaced the state’s capacity.
The Bolivian government planned to use its newfound wealth to develop new industries, but it also directed money toward social spending. The original plan was to industrialize the country’s gas, petroleum, mining, and forest resources. The national plan focused on adding value and moving away from exporting raw materials. The 2016-2020 plan, however, accepted that an industrial economy was not in place after ten years. The new plan set state surpluses to maintain redistribution and social protection. By 2020, authorities had failed to channel boom resources into job-creating sectors.
Congress passed a new gas tax in 2005, requiring new gas fields to pay the same tax as old ones, thereby discouraging new exploration. The 1996 hydrocarbons law cut the royalties on new fields from 50% to 18%. Gas and oil tax collection dropped from 50% of total output in 1998 to 27.9% in 2004. Congress approved new legislation in 2005 to return the state’s taxes and royalties to pre-1996 levels, from 18% to 50%. The new rates applied to new and old fields alike, which made exploration investments unviable. This new tax brought in 6.1% of GDP, about US$685 million, in 2006. In May 2006, a nationalization decree gave the state an additional 32% of the output from the largest fields. In 2006, the two fields, San Alberto and Sabalo, paid the state about 82% of their total output.
Central Bank loans built plants that the state could not run.
The Central Bank loans supported a urea plant and the lithium plants, but the lithium plants produced almost nothing. By 2017, the Central Bank had lent the state mining firm (COMIBOL) about US$618 million for its main lithium plant. By the end of 2016, a state urea and ammonia plant in Cochabamba was nearly complete. In 2019, the gas producers sold to the urea plant at a loss of US$1.30 per thousand cubic feet.
The state lithium plan reduced its annual goal from 30,000 to 15,000 tons between 2010 and 2019. In 2017, the pilot state lithium plants sold about 60 tons of lithium carbonate. The Uyuni pilot plant recovered less than 50% of its lithium, compared with a 70% average for salt flats. In 2019, the government dissolved the lithium venture with German firm ACI Systems.
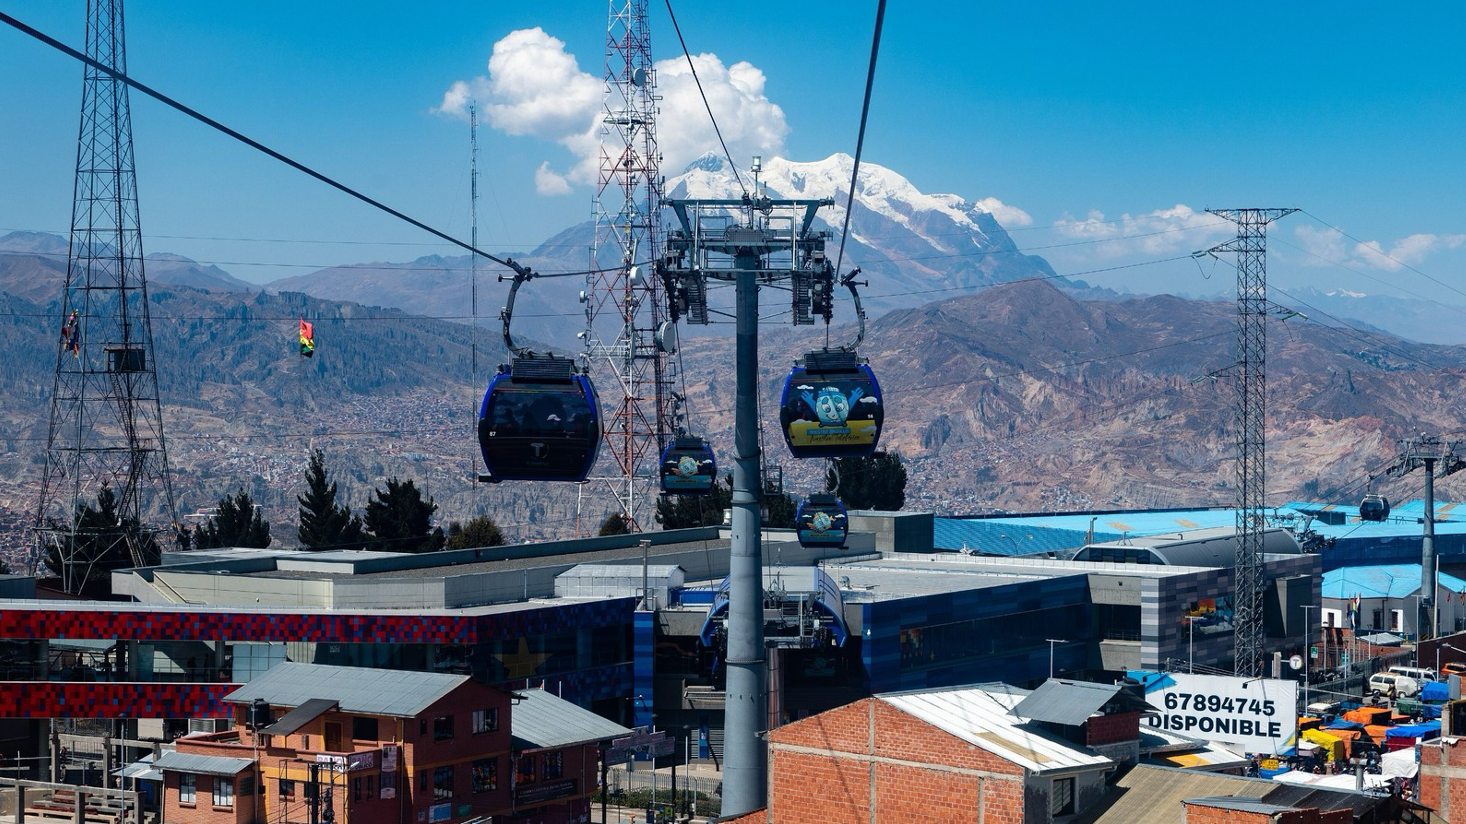
The public sector spent a record US$4.102 billion on investments in 2016. These investments included a cable car system for La Paz. The system allowed people to travel back and forth to El Alto, saving commuting time. The La Paz cable car and the Demerara Harbour Bridge improved transport but did not create new industries.
Chile saved with rules; Bolivia didn’t.
In 1987, Chile created a resource fund with rules to save copper revenues and royalties. The fund worked across different governments, saving more than US$1.2 billion between 1990 and 1994. Bolivia spent the revenue and royalties, and it lacked written controls. As a result, Bolivia’s savings fell from 24% to 13% of GDP between 2014 and 2020. Central Bank reserves fell from US$15.477 billion to US$3.158 billion between 2014 and 2023. Bolivia’s public sector balance shifted from a 3.2% of GDP surplus to a 6.6% of GDP deficit between 2008 and 2016.
Capabilities, not money, decide if gas boom investments work.
The Bolivia gas boom showed that the state was good at extracting revenues and royalties but not good at replacing the gas fields. The 2006 nationalization decree lifted revenues to 64.7% of gas and oil output. Between 2006 and 2009, YPFB did no exploration or maintenance on the fields it took over from private firms. COMIBOL had already lost most of its capabilities in the two decades leading up to 2008. As San Alberto, Sabalo, and Margarita produced less, Bolivia’s total gas output fell to 27.3 million cubic metres per day by 2025. Despite failing to explore for gas or run the lithium plants well, state firms still carried energy subsidies worth about 4.0% of GDP by 2024.
To ensure success, governments need to match the use of boom resources to proven capabilities and skills. Governments should lightly tax new initiatives that explore and discover new resources. Under the 1996 terms, companies discovered Margarita, Sabalo, and San Alberto between 1997 and 2004. Governments need to plan and find alternative funding sources for social programs before the gas boom resources disappear. Central banks should not fund initiatives without the capability to deliver. In 2025, YLB produced only 2,462 metric tons of lithium carbonate, despite the new plant’s 15,000-ton capacity.
Governments should write resource-fund savings into law and protect them from change; Peru changed its spending limits, and Bolivia never had such rules. Governments that ignore these risks will run deficits that will drain dollar savings. What can Guyana learn from Bolivia? Guyana has enough information today to lock in its oil rules now, before the money reshapes the economy. Guyana should keep the exploration terms stable and fix its oil fund withdrawal rules, rather than adjusting to meet short-term needs. Venezuela loosened its oil fund rapidly between 1998 and 2003. In 2024, withdrawals from the Natural Resource Fund rose 58.26% to US$1.586 billion. Guyana should watch where the money goes. Spending the windfall is critical, but Bolivia has shown that a focus on social spending does not create future industry. Non-oil growth is crucial, but the state should only lead where it has shown it can deliver. Bolivia also offers a lesson on exchange rates, even though the International Monetary Fund (IMF) still considers Guyana’s near-fixed exchange rate appropriate.


Leave a Reply