A change in direction for Colombia.
By 2011, Colombia had aligned its fiscal, monetary, and security instruments for stability during an oil boom, but the economy still ended up narrower. In early 2026, Colombia co-hosted the first conference on Transitioning Away from Fossil Fuels with the Netherlands, attended by 57 countries. Colombia is also a core member of the Beyond Oil and Gas Alliance. On 7 August 2026, a new President took office and pledged Ecopetrol recovery as an absolute priority – radically changing direction with respect to fossil fuels.
The oil boom cut poverty in half, but manufacturing exports also halved. I looked at 37 major commodity booms across Latin America and the Caribbean, and only three led to broad durable economic transformations, including Colombia’s smallholder coffee booms. Chile’s first copper boom from 1985 to 1998 is among the few examples of governments effectively delivering transformation from an extractive boom. Chile’s second boom between 2003 and 2014 undid much of the economic diversification of the first boom. This post asks what changed in the Colombian economy between 2003 and 2014, why it changed, and draws policy lessons as Colombia shifts back to extraction, betting that prices will hold.
Oil reached half of exports; manufacturing share halved.
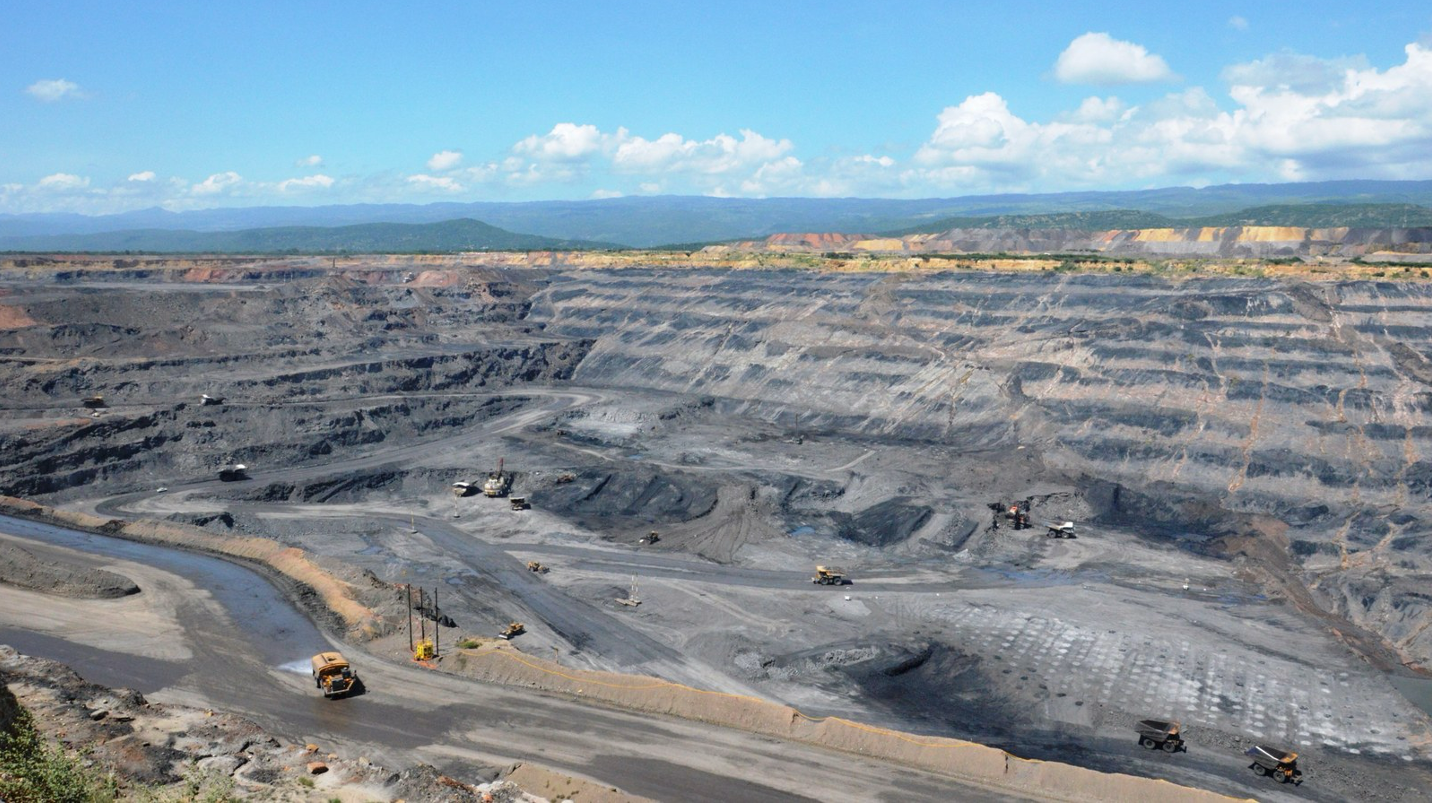
After 2008, oil dominated Colombia’s export basket while manufacturing collapsed. Oil went from 20-30% of exports in the early 2000s to 50% in 2013. In 2011, oil and mining accounted for 8% of GDP and 70% of exports, with crude production at 951,000 barrels a day in March 2012. Manufacturing exports fell from 40% in the mid-2000s to 20% in 2013. Export diversification stalled and reversed after 2008, with Colombia’s export concentration the highest among South American peers, and exports collapsing during the 2014-2016 price shock. Oil prices drove most of the 4% annual GDP growth between 2008 and 2013, directly and through private investment and public spending, while manufacturing grew by 0.1%.
Poverty fell by half from 2002 to 2014, from 50% (2002) to 28.5% (2014) – the main driver was growth and transfers rather than redistribution in a country where the top 1% held about 20% of the income in 2010.
Manufacturing was falling; the boom accelerated it.
High oil prices from 2004 drew in foreign investment in oil and energy, which averaged about 4% of GDP per year from 2006 to 2012. The investments appreciated by over 30% in the Colombian peso. This negatively affected tradables and manufacturing, exposing smaller firms. Manufacturing firms and their workers lost, while extractive firms, importers of cheap goods, and the Treasury gained. Security improved, homicides declined, and coca plantations fell substantially. Establishing savings funds like Norway’s and Chile’s could have helped address some emerging challenges, but Congress legislated the funds in 2011, nine years into the boom, and built a sub-national fund for royalties and a national fund for windfall revenues.
The International Monetary Fund (IMF) attributed the manufacturing decline to the collapse of demand in Venezuela, increased competition from China, and high infrastructure and labour costs. Based on a study of 4,850 firms from 2000-2012, the IMF found no evidence that appreciation affected profitability. In 2014, the World Bank raised initial concerns about Dutch disease but said it was too early to draw conclusions. The Economic Commission for Latin America and the Caribbean (ECLAC) suggested that external demand and prices drove the regional shift back to raw materials. The IMF and ECLAC stories differ from a policy perspective. Venezuela’s demise and Chinese competition likely began a decline that was later accelerated by external price pressures, currency appreciation, and extractive investments. The policy answer would have been to save offshore to address appreciation while budgeting for research, supply chain development, logistics, standards, and skills across future sectors.
One capacity increased slightly, but not enough to shape the economy. Research and development investment was 0.2% of GDP, compared with 1.2% in Brazil and 2.4% across the OECD. The innovation system lacked a strong business core. Exportable business and information and communication technology services, including call centers, grew at about 10% per year from 2004 through to 2015, when goods trade fell. Services exports did not change as a percentage of GDP (2%) or goods exports (15%) between 2000 and 2014, but they did diversify. The largest market share gains were in coal and petroleum.
Stability attracted money; future sectors got a platform.
Between 2003 and 2014, the monetary policy framework was constant, and fiscal policy became so in June 2011. The Banco de la República targeted inflation using a floating peso, limited intervention, and high reserves to absorb shocks. The bank held its policy rate at 3% from April 2010 to February 2011, even though the peso rose 6.4% in nominal terms. Congress passed a new fiscal rule in June 2011 with a deficit pathway to 2.3% of GDP by 2014 and 1% by 2022. In the same year, Congress created two funds: a national sovereign wealth fund for windfall revenue and a sub-national savings and stabilization fund for royalties. Banco de la República and the finance ministry focused instruments on oil revenues rather than on asking what the economy would sell in the future when the boom ended.
Chile built its countercyclical instruments during its first copper boom and had them in place before the supercycle; it still lost economic diversity in the second boom. Chile created the Copper Stabilization Fund in 1987 and, in 2001, added a structural fiscal rule. Chile established the Economic and Social Stabilization Fund in 2007 amid a copper boom. They shifted toward inflation targeting in the 1990s, following the fiscal discipline of the 1982-83 crisis. Chile’s structural balance rule was countercyclical in theory, though it was changed several times between 2000 and 2014 in response to non-copper cycles and copper prices. Chile had among the largest terms-of-trade gains during the period, saved abroad, and appreciated less than Colombia. After the first boom, copper fell to 35% of exports by the 1990s. It rose to 50% during 2010-2014, peaking at 54% of goods exports in 2011. Copper exports doubled as a share of GDP from the 1960s (8.1%) to 2010-2014 (16.4%). The instruments built in the first boom saved the windfall from the second boom but did not maintain economic diversity.
Royalties spread the windfall, but the platform was unfunded.
Royalties helped distribute the windfalls in Colombia, and productive platforms described new sectors, but did not provide the money to build them. A new General Royalties System in 2011 shifted funds from producing regions, which had previously received the largest share, to a criteria-based system for infrastructure projects. The reform reduced the concentration of royalties in a few productive departments. In 2008, the Ministry of Trade and the Private Council for Competitiveness developed a new competitiveness agenda. The agenda focused on auto parts, electrical goods, graphic communication, textiles and fashion, business process outsourcing and offshoring (BPO&O), software and information technology (IT), cosmetics, and health tourism. The agenda included early results through training agreements and quality management arrangements. Unfortunately, the process was overdesigned and underfunded – only 19 of 103 initiatives were finished by September 2013. BPO&O, software, and IT had already been growing about 10% a year since 2004, well before the platform was established, and continued to grow. The main gaps were supplier development and money for named sectors; security, macroeconomic discipline, fiscal management, and investor confidence were well funded.
From 2014 to 2016, oil prices collapsed. Services exports survived, but oil revenues and goods exports were hit hard. The 2011 program projected oil revenues at 3.2% of GDP through to 2016. Central government oil revenues fell from 3.3% of GDP in 2013 to 0.1% in 2016, and goods exports fell 33% in 2015. The peso lost 24% in real terms while the current account deficit reached 6.5% of GDP, and growth slowed. The government sought structural tax reforms to avoid a 1.4-point cut in primary spending as a share of GDP between 2017 and 2021. The savings and stabilization mechanisms existed in statutes, but a 2019 review called for strengthening them to address the challenge. By 2016, depreciation was lifting industry and non-traditional exports, while the fourth-generation (4G) road concessions program and the US$2 billion ISAGEN sale supported investments.
Discipline managed the windfall; prices determined direction.
The fiscal and monetary instruments that Congress and the Banco de la República put in place from 2011 helped ensure stability, but the economy ended the boom on a narrower note. The 2022-2026 government positioned itself as a net oil exporter and a leader in the move away from fossil fuels. The new government in 2026 is pointing in the other direction, focusing on Ecopetrol and extraction, particularly through fracking. The last boom reduced structural diversity, accelerating a process that began with the decline of Venezuelan markets and the rise of Chinese competition.
Fiscal rules and royalty systems can distribute a windfall, but they do not set the country up for the future. Naming competitive platforms and sectors without funding them does not build a durable future economy. Analyzing the share of non-boom tradables in the economy is an effective way to evaluate boom management. In the Colombia boom, services exports stayed at 2% of GDP, even though they grew 10% annually. Chile developed non-mining exports, such as wine, fruit, salmon, and forest products, around and after its first copper boom. In the second boom, those sectors lost share to copper.
Colombia’s savings fund appeared nine years into its only oil boom. Chile’s fund appeared during its first copper boom. Chile had run and tested its instrument when the second boom arrived.
The International Energy Agency expects global oil and gas demand to peak before 2030, with Latin America and the Caribbean supply rising to 11 million barrels a day. Countries that refocus on extraction are choosing prices for the next 5 years rather than considering longer-term shifts. The fall in oil revenue from 3.3% of GDP in 2013 to 0.1% in 2016 shows the risks. Today’s question for Colombia is which tradables will have a larger share of the economy when the boom ends, and which instruments will make that happen.


Leave a Reply